
ASPECT RATIO
CALCULATOR
Two Practical Tools for Framing and Data Planning
I first built these tools back in 2024 because I kept running into the same two questions on real productions: “What should this frame actually be?” and “How much data are we going to generate?” At first, they were simple calculators. Over time, I kept adding the things I actually wanted to have on set, during prep, and in post. Today, this page has grown into two more complete tools: an Aspect Ratio & Monitor Overlay Toolkit for framing and deliverables, and a DOP / DIT Video Data Rate Reference for camera formats, recording data and media planning. They are still designed around one idea: get the technical stuff out of the way quickly, so you can focus on the image.
ASPECT RATIO & OVERLAY TOOLKIT
Build framing guides, platform safe zones and monitor overlays inside a custom sensor / canvas reference.
Framing Preview
1. Aspect Ratio & Monitor Overlay Toolkit
When a 3.14:1 billboard made things more complicated than I expected
Recently, I had a pretty fun job. The main deliverable was 16:9, but we also needed a super-wide 3.14:1 billboard, and of course there was no escaping 9:16 for social. Those three frames basically live in three different worlds, but the budget and schedule definitely did not allow me to bring three cameras and shoot everything three times.
So I ended up using a Sony FX5, shooting 3:2 Open Gate with a 1.5x anamorphic lens. After desqueeze, 3:2 × 1.5 gives me an image area of roughly 2.25:1. The idea was pretty simple: start with a source that is wide enough and tall enough so I can later crop out the 3.14:1 billboard, the 16:9 master, and the vertical 9:16 version while still having some room to reframe. Sounds pretty good on paper. Until I plugged in the monitor. This was also my first time using the FX5 for anamorphic work. The rental house provided a Tilta Nucleus Auto Focus E-PL adapter, and with the setup I was using, autofocus only worked when I did not enable desqueeze in-camera. Okay, that makes sense. No big deal. My first thought was simple: just send the squeezed image out of the camera, enable 1.5x desqueeze on the Ninja V+, then use the monitor’s Frame Guides to frame 3.14:1, 16:9, and 9:16 at the same time. And this is where things started getting a little… weird.
The problem was not the anamorphic lens. It was the 16:9 frame in between.
My Open Gate image was 3:2, but the monitor was receiving a standard 16:9 video signal. In simple terms, the camera was not sending the monitor a clean, standalone 3:2 frame. It had to place that squeezed 3:2 image inside a 16:9 container, because HDMI/SDI was still working with a standard video raster. So before the image even reached the monitor, it was effectively being packed into a 16:9 signal.
┌───────────────────────────────────┐
│        BLACK / UNUSED AREA        │
│   ┌───────────────────────────┐   │
│   │                           │   │
│   │      3:2 SQUEEZED IMAGE   │   │
│   │                           │   │
│   └───────────────────────────┘   │
│        BLACK / UNUSED AREA        │
└───────────────────────────────────┘
If the monitor could identify the actual image area and only desqueeze the 3:2 Active Image, everything would be fine. But in my case, the monitor basically saw: “Oh, a 16:9 signal. You want 1.5x? Sure.” And then it stretched the entire 16:9 frame, including the black bars. That is where the problem starts.
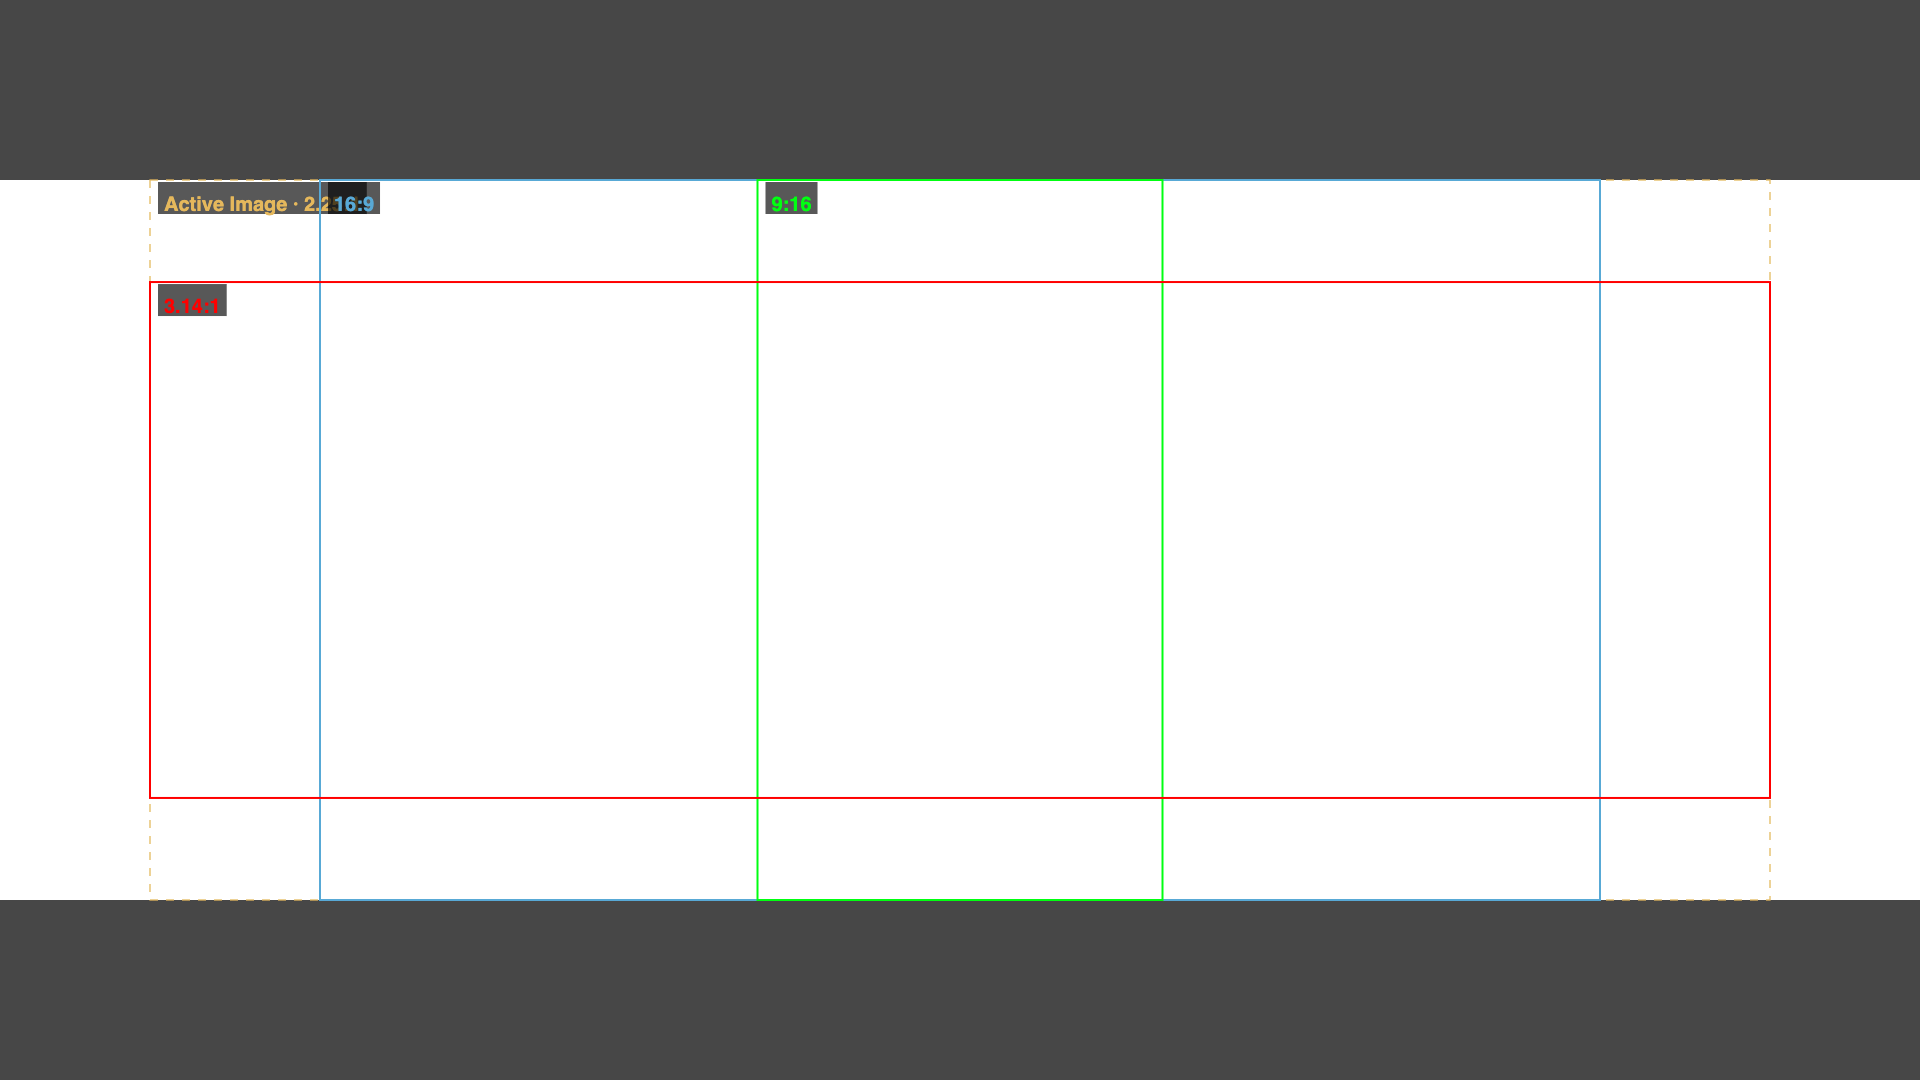
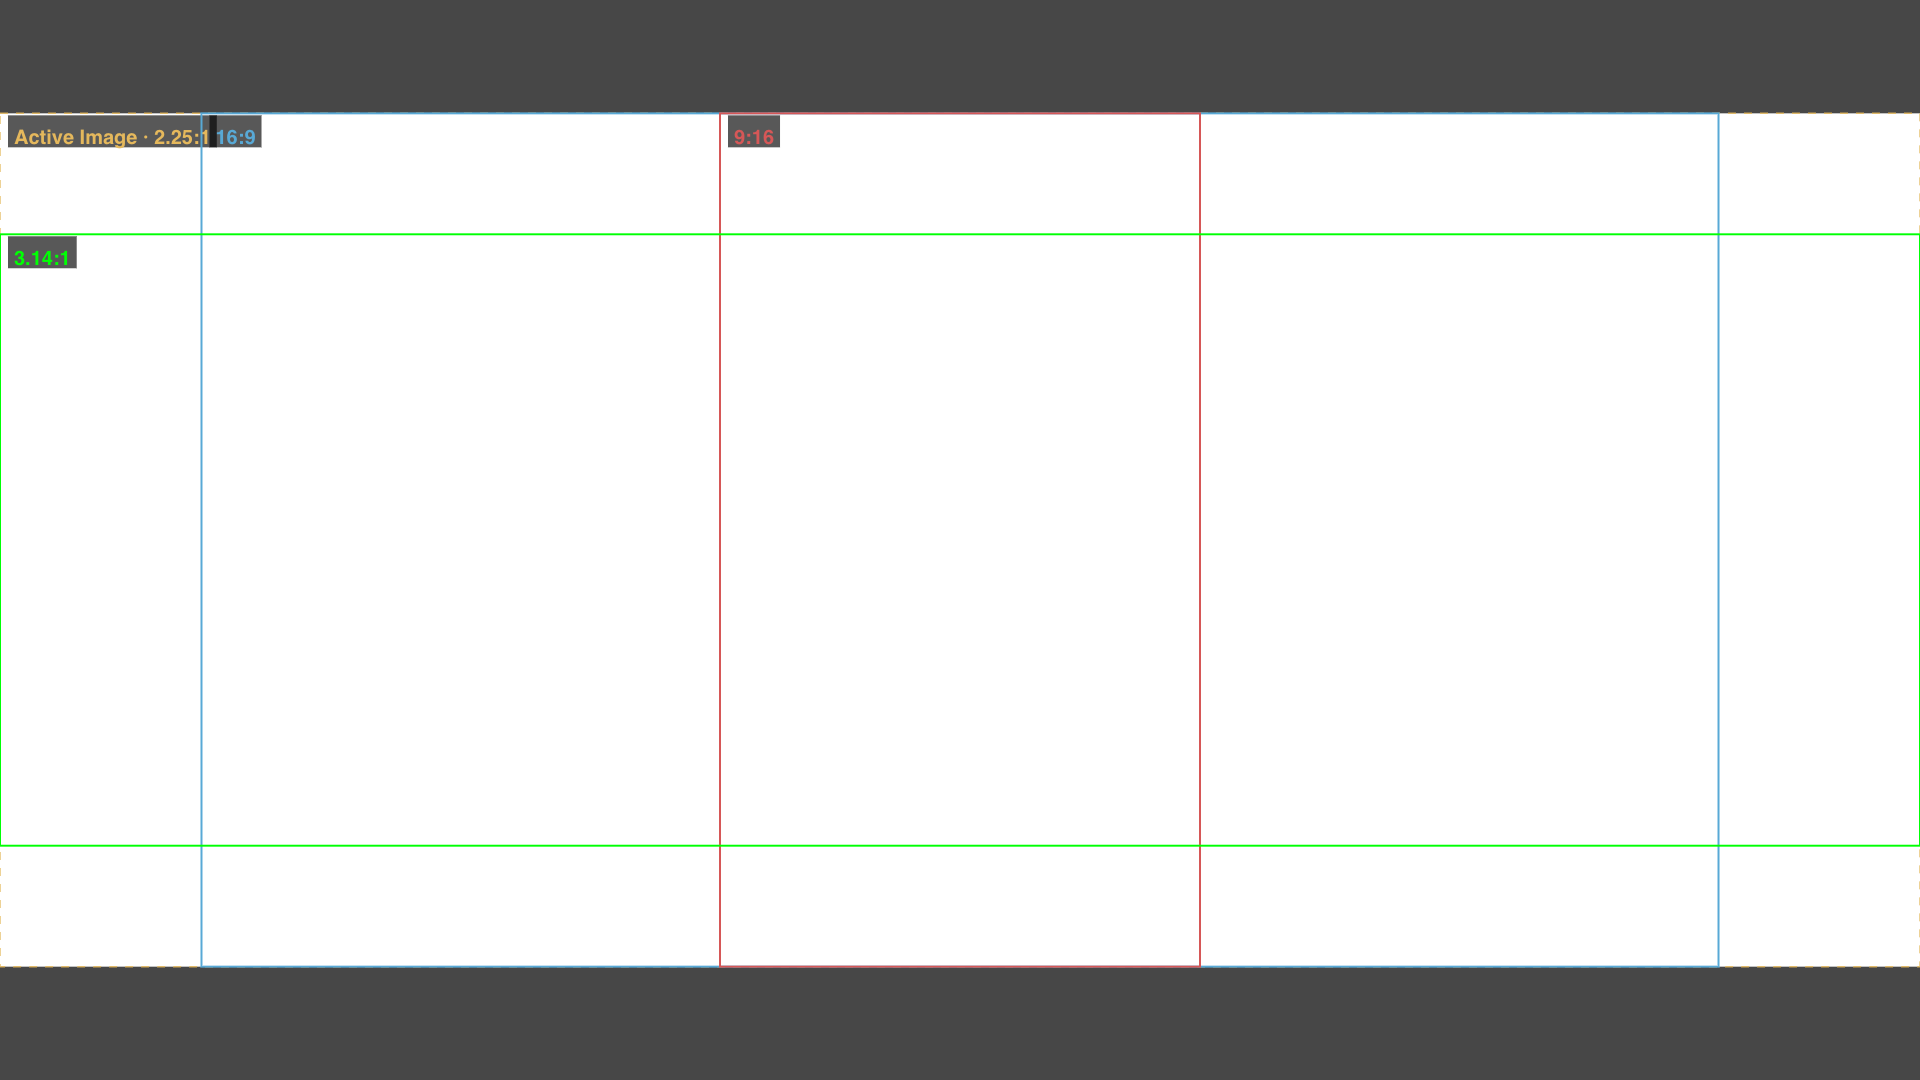
The confusing part is that the lens is still 1.5x, and the math 3:2 × 1.5 = 2.25:1 is still completely correct. The real question is where that 2.25:1 image actually ends up on the monitor after all the scaling steps. For example, if the camera desqueezes the 3:2 image first and then fits the resulting 2.25:1 image inside a 16:9 signal, the Active Image will use almost the full width of the monitor and take up roughly 79% of the screen height. But if the monitor receives the full 16:9 signal containing the 3:2 image plus black bars, and then applies a 1.5x desqueeze to that entire signal, the final image area may end up using only around 84% of the screen width and 67% of the screen height. Same footage. Same 1.5x lens. But the actual image is now sitting in a very different place on the monitor. And if I place a 3.14:1 Frame Guide based on the full screen at that point, the guide may look very professional… while actually telling me the wrong thing about what I am framing.
There are two ways to deal with it
The cleanest option, if your workflow allows it, is to desqueeze in-camera. The camera processes the anamorphic image first, then sends a correctly proportioned image to the monitor. At that point, the monitor does not need to desqueeze anything. It simply displays the signal coming from the camera. Frame Guides and overlays also become much easier to manage because what you are looking at is already the final desqueezed image. In my case, though, that option interfered with the autofocus setup, so I needed a second approach. If you want to desqueeze on the monitor, the ideal workflow is for the monitor to deal with the actual Active Image first. In other words, it should crop, zoom, or scale away the black bars or padding added by the camera, and only then apply the 1.5x, 1.8x, or 2x desqueeze. The correct order would be: 16:9 Signal → identify the Active Image → crop / fit → desqueeze → Frame Guide
Instead of: 16:9 Signal + black bars → desqueeze everything → hope for the best
The problem is that every monitor handles this a little differently, and you do not always get the exact crop or scaling option you need. And this is where the Anamorphic / Desqueeze section of the tool starts becoming useful.
Can’t fix the monitor? At least calculate what the monitor is actually doing
Monitor — Full Signal (includes bars): this mode simulates the real processing chain happening on the monitor: Open Gate source → packed into a 16:9 signal → monitor desqueezes the entire signal → fits it back onto the screen → finds the final Active Image → places the Frame Guide inside it
In other words, the tool does not pretend the monitor is handling the image in the “ideal” way. It actually calculates the slightly awkward processing the monitor is really doing.
For a setup like:
- Reference Frame: 3:2 Open Gate
- Squeeze: 1.5x
- Monitor Signal: 16:9
- Workflow: Monitor — Full Signal
- Guide Space: Final Active Image
the tool calculates the real position of the image after the entire 16:9 signal, including the black bars, has been desqueezed. From there, I can place 3.14:1, 16:9, 9:16, or any other Frame Guide exactly where it needs to be, then export the result as a transparent PNG overlay. And that is the part I actually need on set: not a guide that is “mathematically correct in theory,” but a guide that matches what I am actually seeing on the monitor.
2. Bitrate ↔ File Size Calculator & DOP / DIT Video Data Rate Reference
Framing tells you what will be inside the image. Data planning tells you whether you can actually record all of it. Modern cameras can generate a lot of data very quickly. ARRIRAW, X-OCN, BRAW, N-RAW, Cinema RAW Light and high-quality ProRes formats can turn a few hours of shooting into hundreds of gigabytes or several terabytes. This section combines two related tools. The first is a simple Bitrate ↔ File Size Calculator. The second is a much deeper DOP / DIT Video Data Rate Reference.
BITRATE CALCULATOR
Lock one value, then change either of the other two. The calculator will solve the remaining value.
DOP / DIT Video Data Rate Reference
Choose the camera, sensor/scan mode, codec, recording raster and frame rate. The tool then calculates the practical storage load instead of forcing you to scan a giant table.
Comparison tray
Add several camera configurations to compare real storage impact.
A Note About Bitrates
Not every recording format behaves the same way. Some formats have predictable or fixed data rates. Others use VBR or Constant Quality compression, where the actual file size can change depending on the image. For that reason, the reference distinguishes between manufacturer-published values and figures transparently derived from official recording-time, MB/s or per-frame information. For formats such as H.264 and H.265, there is no single universal “H.265 Bitrate.” The actual data rate depends on how the camera manufacturer implements the codec and which recording preset you choose. Treat the numbers here as a planning reference, and always check the latest camera documentation when a production depends on an exact recording limit.
A Storage Math
For a constant Bitrate, a quick decimal-storage estimate is:
File Size (GB) ≈ Bitrate (Mbps) × Duration (seconds) ÷ 8000
For example:
A camera recording at 240 Mbps for 1 hour: 240 × 3600 ÷ 8000 ≈ 108 GB
That is the theoretical media payload. In the real world, leave extra room for filesystem overhead, additional takes, sound files, proxies and the very normal possibility that the camera keeps rolling longer than planned. For DIT work, “exactly enough storage” usually means not enough storage.
GB & GiB - they look similar, but they are not the same
This is one of those things that can get surprisingly confusing when planning data on set: GB and GiB are often used interchangeably, even though they are not exactly the same.
GB uses the decimal system: 1 GB = 1,000 MB = 1,000,000,000 bytes
GiB uses the binary system: 1 GiB = 1,024 MiB = 1,073,741,824 bytes
The difference sounds small, but once you start dealing with a few hundred GB or a few dozen TB, the gap becomes noticeable. For example, let’s say I am recording at 100 Mbps for 1 hour.
Using GB: 100 × 3,600 ÷ 8 ÷ 1,000 = 45 GB
Using GiB: 100 × 3,600 ÷ 8 ÷ 1,024 ≈ 43.95 GiB
It is the exact same amount of data, but one system shows roughly 45 GB, while the other shows about 43.95 GiB. Neither one is “wrong.” They are just using two different ways of counting.
Why does it happen?
Basically, the storage industry and the computer world grew up using two different conventions. Hard drive, SSD, and memory card manufacturers usually use decimal GB, because it is easier to standardize and it is also how storage capacity is normally advertised. Operating systems and some software, on the other hand, have traditionally worked with powers of two, the 1024-based system. For a long time, a lot of software simply called those values “GB” as well, even though technically they are closer to GiB. That is why you can buy a “1 TB” drive, plug it into a computer, and see a lower-looking number than what is printed on the box.
If the goal is data planning on set, I recommend using decimal GB.
The main reasons are:
- SSDs, memory cards, recording media, and hard drives are usually sold in decimal GB/TB
- camera documentation and media capacity numbers are easier to compare this way
- producers and production teams are already used to numbers like 500 GB, 1 TB, 2 TB
- when estimating card runtime, daily data, or total storage requirements, decimal GB is easier to work with
That is why this tool uses: File Size (GB) = Bitrate (Mbps) × Duration (seconds) ÷ 8000
For example: 500 Mbps × 1 hour ≈ 225 GB
That is the number I would use when planning memory cards, SSDs, and total data for a shooting day. GiB is still useful when checking the exact capacity reported by an operating system, a filesystem, or software that displays storage using binary units.
An easy way to remember it
GB = useful for production planning
GiB = useful for understanding what the computer is actually reporting
For DIT work, I usually prefer decimal GB/TB for workflow and storage planning, then convert to GiB only when I need to compare that number with what the system is actually showing. The most important thing is not choosing a “GB side” or a “GiB side.” It is simply not mixing the two systems in the same table. If a calculator says GB, the formula should use decimal GB. If it is showing GiB, it should clearly say GiB. That is also why my Bitrate Calculator uses decimal GB, the result lines up better with how real-world media and storage capacities are usually labeled.