OPTICLOG
IMAGE ANALYSIS
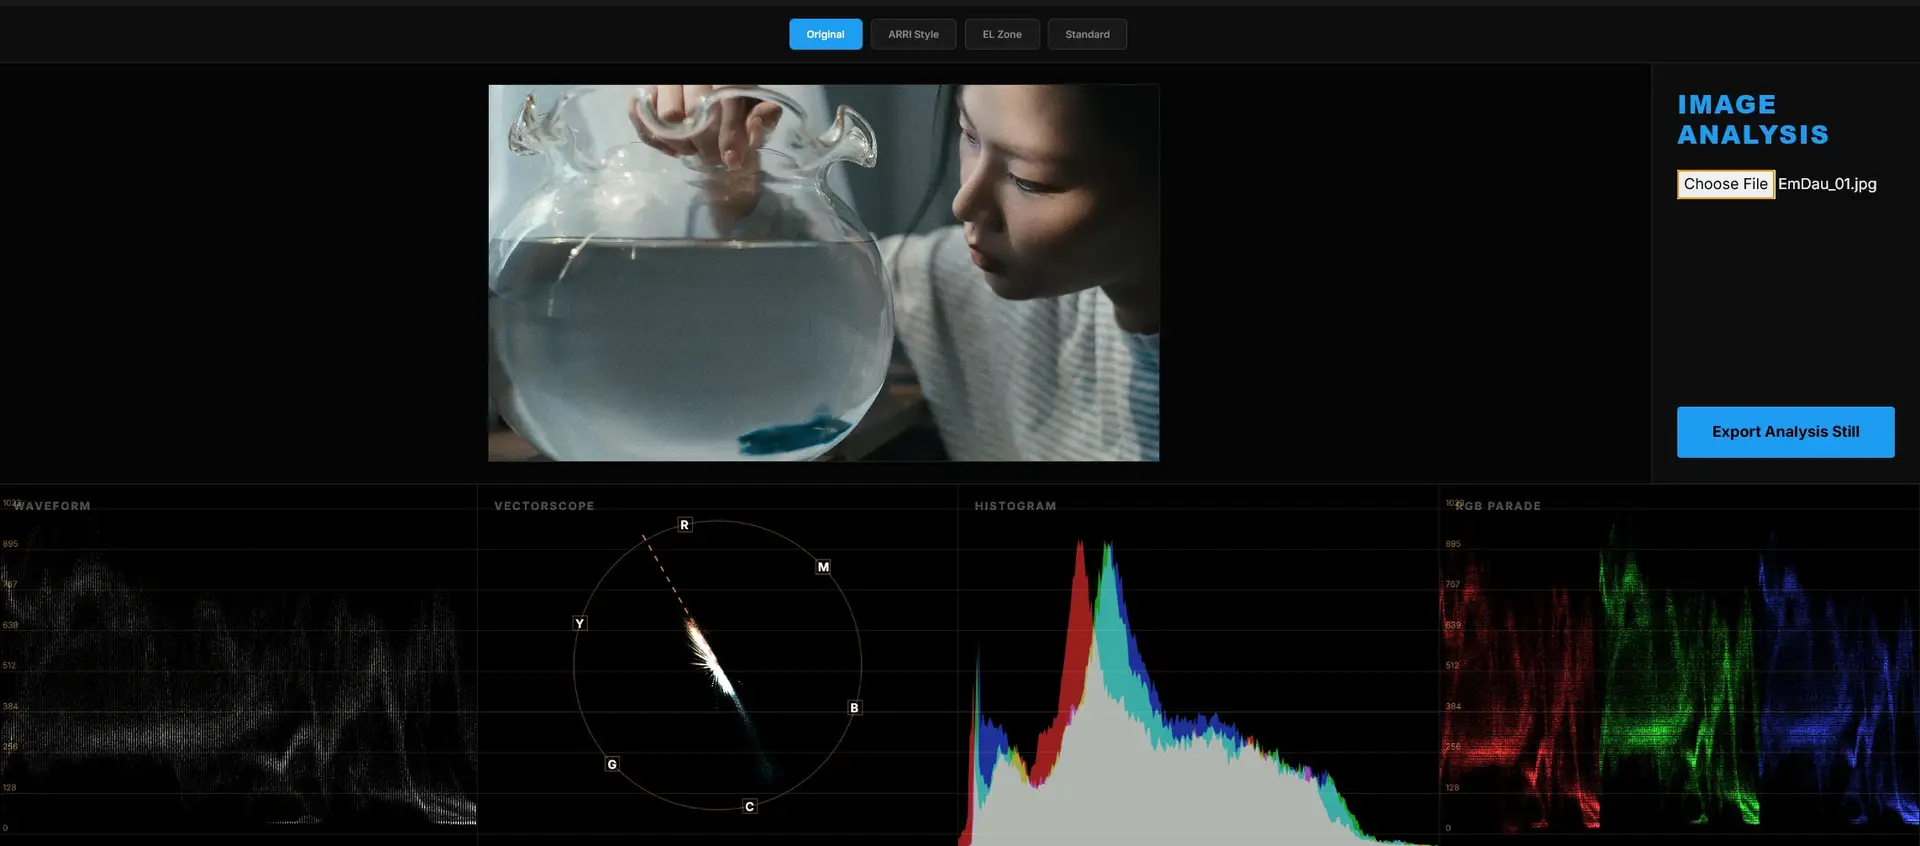
Why this tool?
As a DP and a Colorist, I’ve always believed that a great grade starts with a perfectly exposed frame. I created OpticLog to empower fellow creators with a professional-grade monitoring suite accessible from any browser.
Beyond standard analysis, this tool integrates a sophisticated 15-stop exposure mapping system. By translating raw luminance into logarithmic stops, it allows DPs and Colorists to precisely calculate contrast ratios directly from a still—effectively acting as a digital light meter. Combined with a custom-built Vectorscope and RGB Parade designed to mimic high-end grading monitors, OpticLog ensures your creative vision is always backed by scientific accuracy.
OPTICLOG
The Math Behind the Mood: Building a Pro-Grade Image Analysis
In cinematography, "eyeballing" your exposure is a luxury we can rarely afford. Whether you’re on a high-end commercial set or grading a music video, precision is the difference between a clean image and a noisy disaster.
To bridge the gap between production and post-production, I’ve developed OpticLog - a web-based analysis tool designed for DPs and Colorists. But this isn't just a color filter; it’s a math engine. Here’s a look at the logic under the hood.
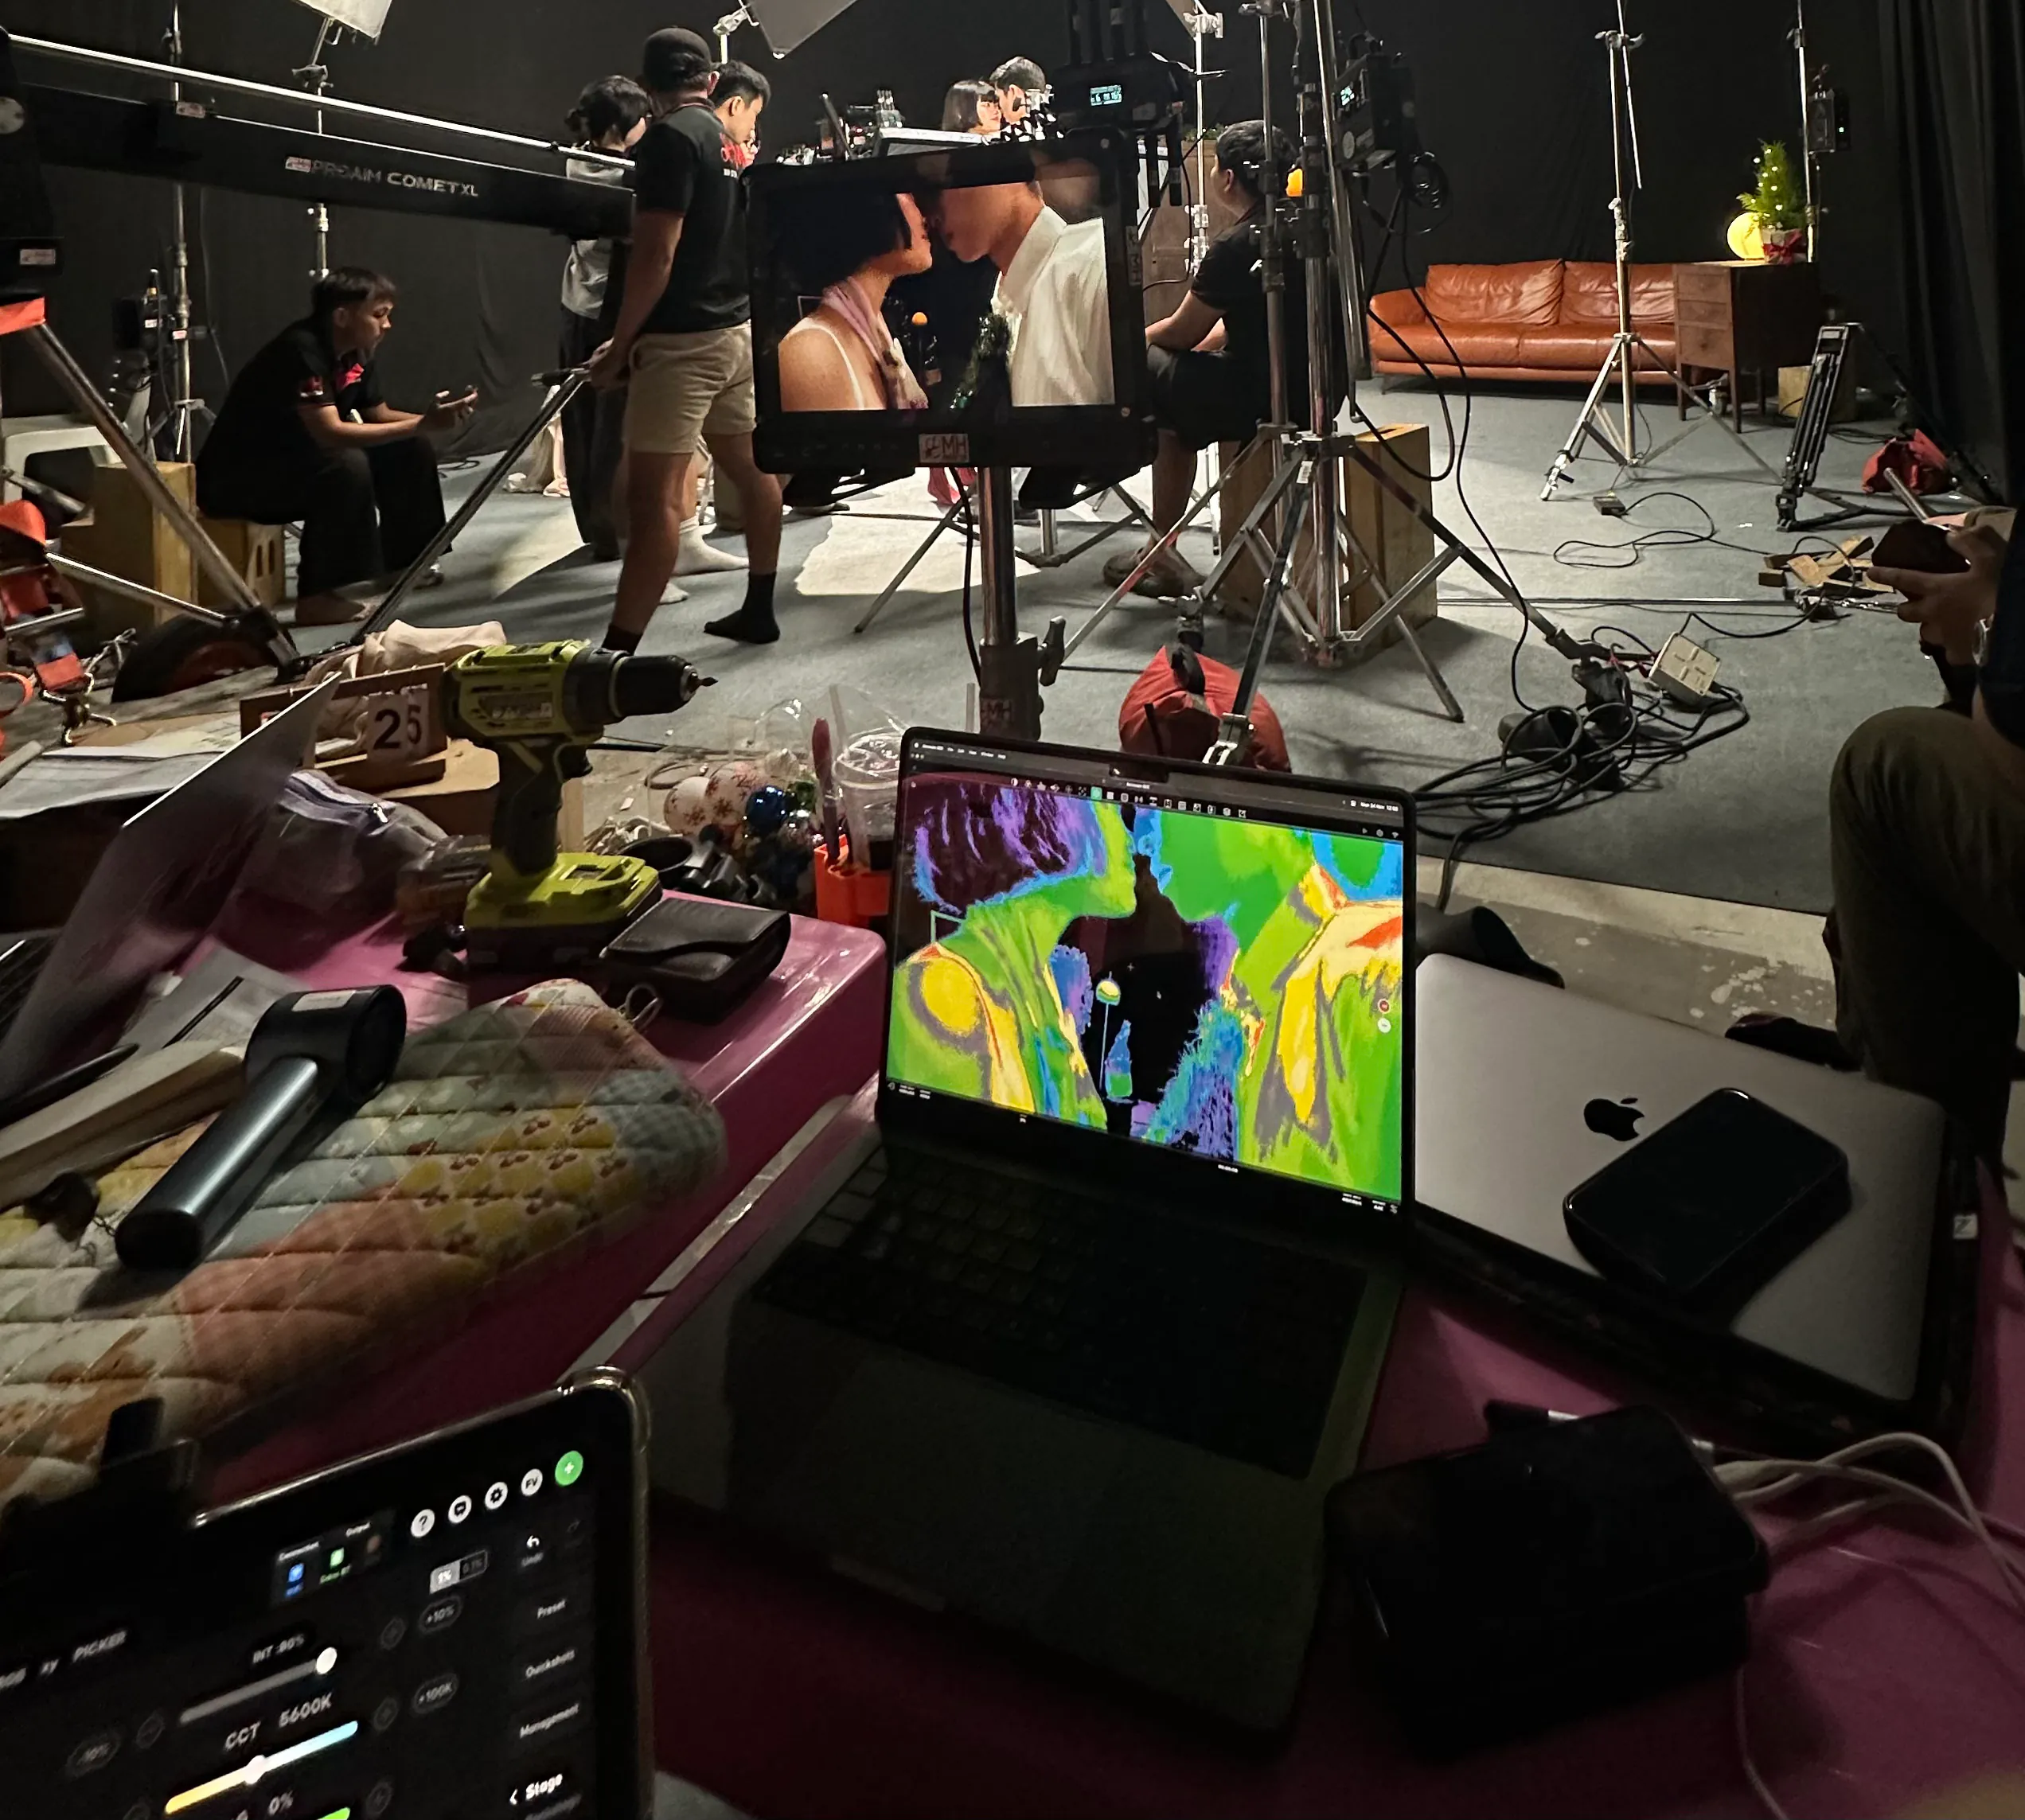
To support your creative process beyond the browser, I am also giving away a dedicated LUT pack named 'ND - EL Zone'. This pack allows you to perform real-time image analysis directly on your monitor while on set—especially useful if you are using monitors that do not have built-in EL Zone or Log Stop features (like those from SmallHD, Atomos, or Portkeys).
1. Beyond RGB: The Luminance Logic
Computers see images as a grid of RED, GREEN, and BLUE pixels. However, the human eye doesn't perceive these colors with equal brightness. To build a tool that truly reflects exposure, we first have to calculate Luminance (Y).
Using the Rec.709 standard, the tool applies a weighted mathematical formula to every single pixel:
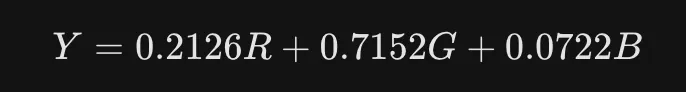
This ensures that the "brightness" we analyze matches exactly how our eyes and our monitors see the world.


"Generic" Standard False Color based on IRE signal.
Movie: Sicario (2015)
Director: Denis Villeneuve
Cinematographer: Roger Deakins
The Problem with "Generic" False Color
One of the biggest frustrations on set is the lack of a universal standard for False Color. Most third-party monitors implement a generic, linear IRE-based scale that varies wildly from brand to brand. In these systems, colors are often arbitrarily assigned to brightness percentages, making it nearly impossible to maintain exposure consistency when switching between different monitor hardware.
The fundamental flaw of generic False Color is that it treats light linearly, whereas cinematography is a world of Stops. This is why professional standards like ARRI’s False Color or Ed Lachman’s EL Zone System are so revered—they are sensor-based and logarithmic.
OpticLog was built to eliminate this guesswork. Instead of relying on inconsistent IRE values, it uses manufacturer-specific mathematical transforms to 'de-log' the data. By mapping exposure to a 15-stop scale relative to 18% Middle Gray, OpticLog provides a constant, scientific reference that remains accurate regardless of the display hardware. It brings the high-end precision of an ARRI or a specialized EL Zone monitor to your browser, ensuring that your 'Gray' is always Middle Gray and your 'Yellow' is always exactly one stop above, every single time."


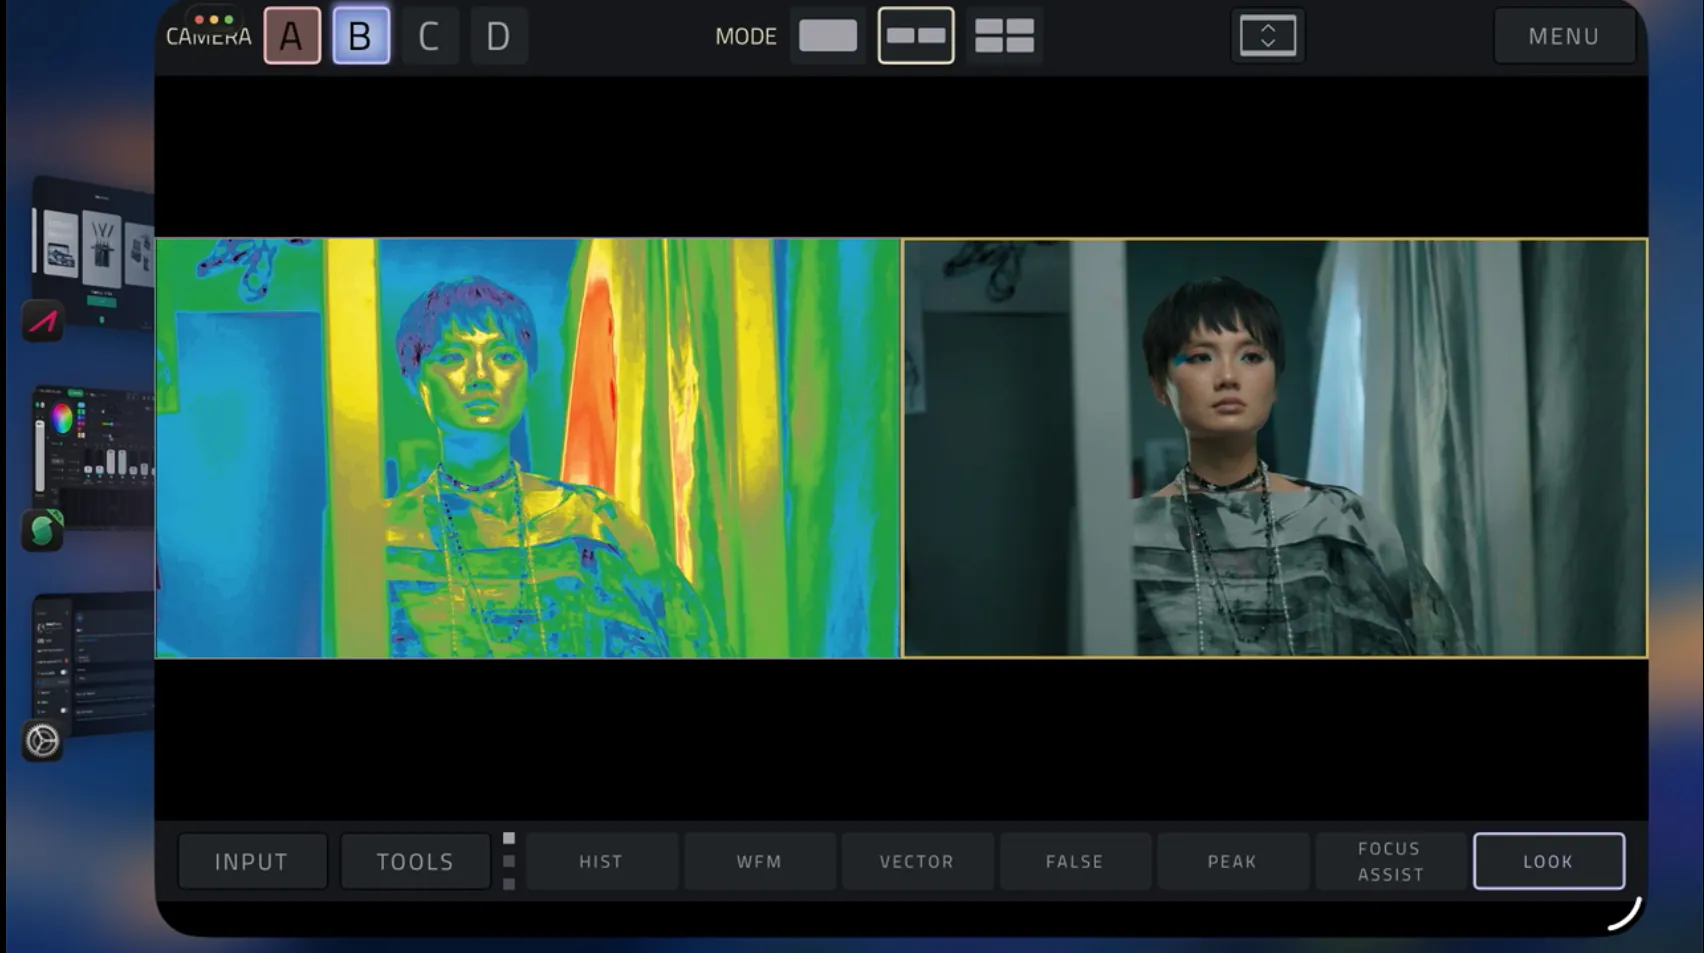
EL Zone with Rec.709 image
TV Series: Euphoria Season 3 (2026)
Director: Sam Levinson
Cinematographer: Marcell Rév ASC, HCA
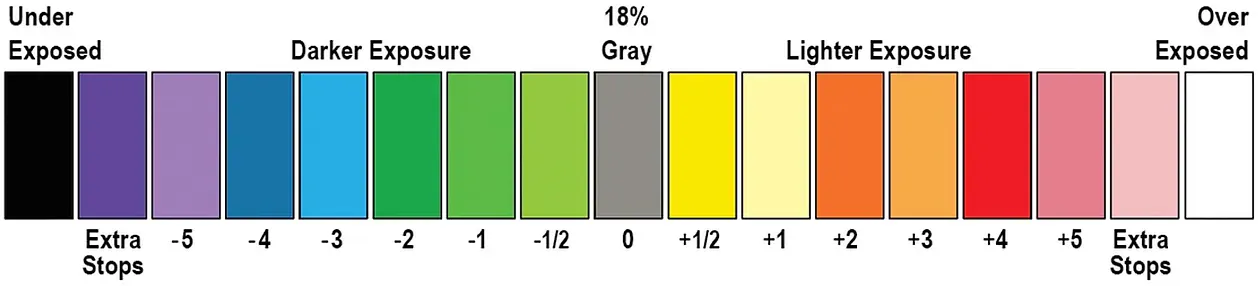
2. The Magic of Logarithms (EL Zone System)
The crown jewel of this tool is the EL Zone System, inspired by the legendary Ed Lachman, ASC. Unlike traditional IRE scales which measure video signal voltage, EL Zone is Logarithmic.
Why does this matter? Because light behaves exponentially. By using a Base-2 Logarithm, this tool maps every 1-stop change (doubling or halving of light) to a consistent color zone, mimicking how a light meter and the human eye actually perceive exposure.
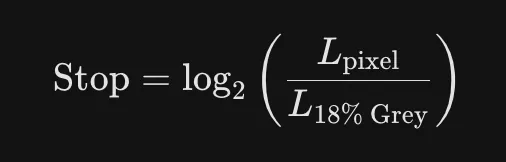
By calculating the distance from Middle Gray (0 stop), the tool maps 15 distinct zones. When you see Yellow, the math tells you you’re exactly +1 stop above gray. When you see Blue, you’re -3 stops below. It turns your image into a literal light meter map.


EL Zone with Slog3 image
Director: Ho Hai An Khuong
DOP: Duong Truong
3. Reverse Engineering the Sensor (Multi-Gamma Support)
The most challenging part of building this was handling Log Profiles (S-Log3, LogC3/C4, REDLog3G10). A raw Log image looks flat and gray because the camera "squeezes" the data to save dynamic range.
To show the real exposure, the tool performs an Inverse Gamma Transform. It uses manufacturer-specific math to "de-log" the pixels back into a Linear state before calculating the stops. This means if you upload an S-Log3 file, the tool "undoes" the Sony curve to tell you the truth about what the sensor actually saw on set.


AWG4/LogC4 Reference Image
4. The "Gamma Drift" Challenge & The Free Solution
One of the most persistent hurdles in web-based analysis is how browsers handle color space. When you export a "Grab Still" (JPG/PNG) from DaVinci Resolve, you are essentially flattening a high-dynamic-range image into an 8-bit sRGB/Rec.709 container. While OpticLog can process TIFF files, the sheer amount of RAM required by JavaScript to analyze uncompressed 10-bit or 16-bit data often causes browser instability or crashes.
Because of this 8-bit conversion and the browser's forced color management, the EL Zone readings may show a slight "drift" of 0.5 to 1 stop compared to the original raw sensor data.
To ensure you have the most accurate exposure reference possible, I have created a Custom ND EL LUT Pack. Instead of relying on a browser's interpretation, you can apply these LUTs directly:
On Set: Load them into your monitor to see 15-stop EL Zone mapping in real-time (This pack is specifically for monitors that lack native EL Zone integration, unlike high-end brands like SmallHD, Atomos, or Portkeys that already feature their own measurement systems). Additionally, I’ve included two EL Zone indicator overlay .png files within the pack. Simply load them onto your monitor as a custom overlay, and voilà!—you now have a professional monitor equipped with "a true EL Zone system".
In Post: Apply them as a dedicated Monitoring FX node in DaVinci Resolve to evaluate your original LOG footage without any bit-depth or gamma conversion errors.
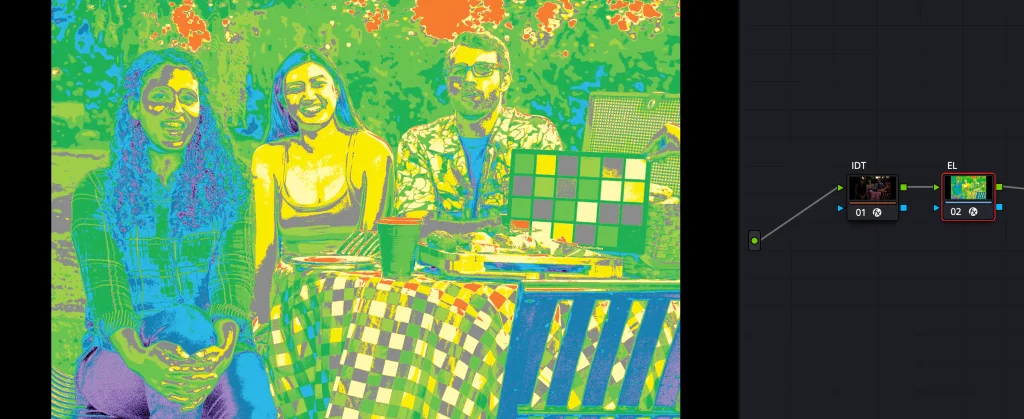
S-log3/S-gamut3.cine in Davinci Resolve
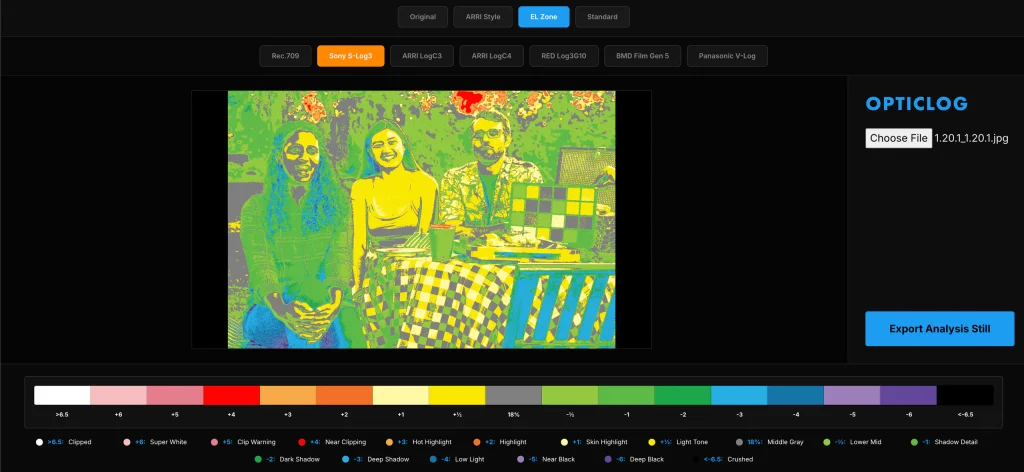
S-log3/S-gamut3.cine in OpticLog
Important Note: To ensure scientific accuracy, please make sure to select and apply the LUT that matches your camera's specific Gamma profile (e.g., S-Log3, LogC4, etc.)."
5. Wireless Monitoring: The "Do's and Don'ts" of Using LUTs via HDMI/SDI
What You Can Achieve:
If you are using a high-quality, uncompressed wireless system (such as a Teradek Bolt or similar Zero-Delay technology), you can confidently apply our LUTs on your monitor. Since these systems transmit a clean, non-subsampled signal, the ND - EL LUT math remains highly accurate. By sending a 'Clean Log' signal from the camera and applying the LUT at the monitor stage, you bypass the camera's internal processing and gain a professional-grade EL Zone reference for real-time exposure adjustment.
What to Avoid (The Limitations):
However, there are two critical factors that can lead to 'Exposure Drift':Compression Artifacts: In budget-friendly wireless kits that use heavy H.264/H.265 compression, the signal often suffers from 'macro-blocking' in the shadows and highlights. This compression can shift the luminance values of individual pixels, potentially causing your EL Zone colors to 'flicker' or show a 0.3 - 0.5 stop discrepancy.
The Full vs. Legal Range Trap: This is the most common pitfall. If your camera outputs 'Full Range' but your wireless transmitter or monitor interprets it as 'Legal/Video Range,' the signal will be clipped or crushed. This results in an immediate failure of the 15-stop mapping, as the 18% Middle Gray point will no longer sit at its mathematically intended coordinate.
Compression Artifacts: In budget-friendly wireless kits that use heavy H.264/H.265 compression, the signal often suffers from 'macro-blocking' in the shadows and highlights. This compression can shift the luminance values of individual pixels, potentially causing your EL Zone colors to 'flicker' or show a 0.3 - 0.5 stop discrepancy.
The Full vs. Legal Range Trap: This is the most common pitfall. If your camera outputs 'Full Range' but your wireless transmitter or monitor interprets it as 'Legal/Video Range,' the signal will be clipped or crushed. This results in an immediate failure of the 15-stop mapping, as the 18% Middle Gray point will no longer sit at its mathematically intended coordinate.
Pro Tip: To verify your wireless chain, always check a known reference, like an 18% Gray Card on set. If the ND - EL LUT shows 'Gray' on the card, your wireless signal is calibrated and ready for scientific analysis."
6. Vector Math & The Skin Tone Line
On the Vectorscope, we aren't looking at brightness; we’re looking at Chroma (Color).
The tool converts RGB data into U and V coordinates. One critical feature I’ve included is the Skin Tone Line. Mathematically, regardless of ethnicity, human skin color falls on a very specific phase in the color spectrum appx ~103 degree on the vector map.
By drawing this line through the data, the tool allows you to see instantly if your subject's skin is leaning too green or too magenta, ensuring perfect skin reproduction every time.
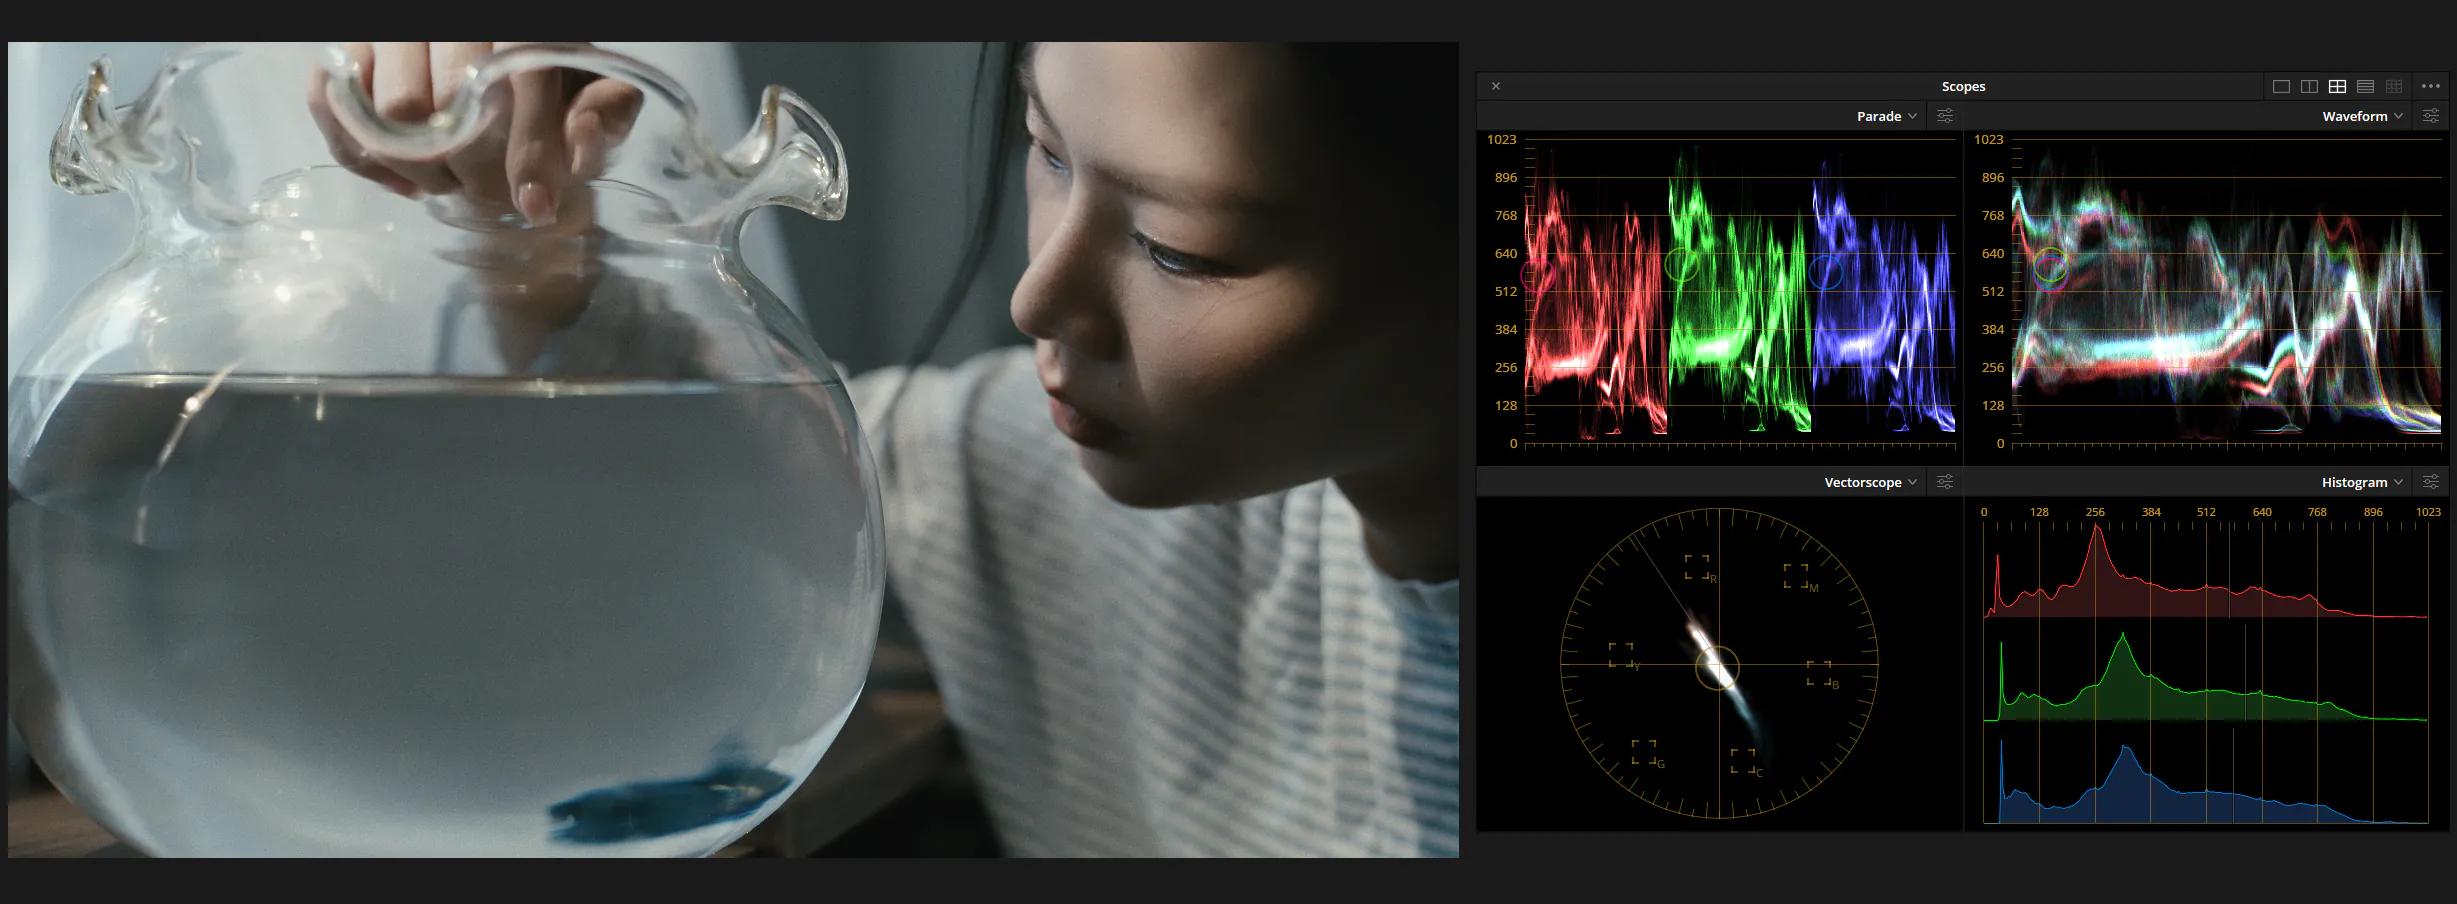
Scopes in Davinci Resolve